دليل

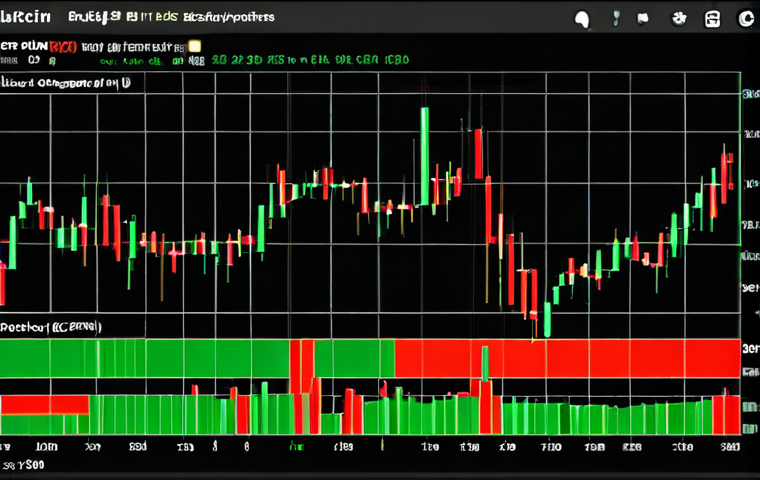
تحليل رسوم بيانية العملات الرقمية: أسرار لا يعرفها إلا المحترفون!
webmaster
مرحباً أيها المتداولون والمستثمرون! عالم العملات الرقمية عالم متقلب ومثير، ولا شك أن تحليل الرسوم البيانية هو مفتاح فهم حركاته ...
INformation For U

مرحباً أيها المتداولون والمستثمرون! عالم العملات الرقمية عالم متقلب ومثير، ولا شك أن تحليل الرسوم البيانية هو مفتاح فهم حركاته ...